Troubleshooting
Use the following procedure to troubleshoot common issues when upgrading the application.
Single Sign-On Windows Authentication is not working
Use the following procedure to troubleshoot SSO issues for Windows Authentication.
In IIS Manager, for each Nuix Discover web server, under Sites, locate RingtailSTS.
Note: Select the RingtailSTS virtual directory and not the versioned directories listed beneath it.
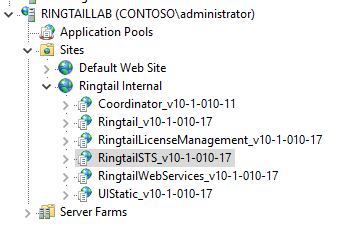
Select Authentication.
Enable only Windows Authentication.
Disable all other authentication types (such as Anonymous, Forms or Basic).
Verify the application pool is available
Use the following procedure to verify that the new application pool is available for Nuix Discover.
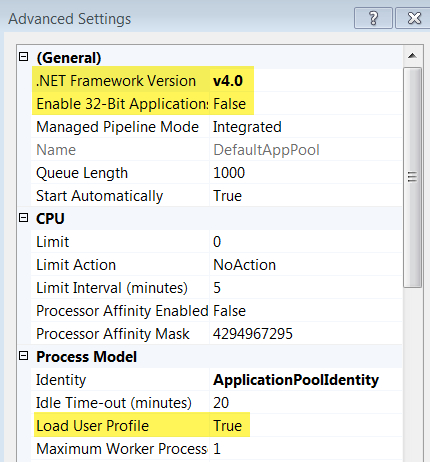
Open IIS Manager, and under Applications Pools, verify that RingtailAppPool exists.
Right-click RingtailAppPool and select Advanced Settings.
Ensure the following are selected:
.NET Framework Version is v4.0.
Enable 32-Bit Application is False.
Load User Profile is True.
Troubleshoot Social Network features
For cases that have been upgraded or migrated, if the social network feature does not work in a case, use the following procedure to resolve the issue.
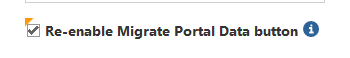
On the Portal Home page, under Portal Options, click the Re-enable Migrate Portal Data box, shown in the following figure.
Return to the Portal home page and refresh your web browser to display the Migrate Portal Data button.
Click the Migrate Portal Data button to submit an RPF job to migrate the data.
After the RPF job finishes, go to Portal Management > Settings > Portal Options and disable the Migrate Portal Data button by selecting the Re-enable Migrate Portal Data button check box, shown in the following figure.

Tips for general failures
If the failure is related to connectivity (for example, unable to connect to the database server), log on to the machine where the service is installed, and try to mimic the connection that was trying to be made. Likely causes include a bad configuration value or a network permissions issue.
If the failure is related to being unable to find an executable, it is likely that the build package is missing a file. Verify that the build package contains all the necessary installers.
If the installation hangs while running an installer, the issue may be related to a bad binary file in the build package. This can occur when the installation attempts to use an installer that was not fully copied. Log on to the machine and attempt to manually run the installer that failed.
If the installation hangs while attempting to restart RPF, this is a known issue. To resolve, manually restart the RPF service.
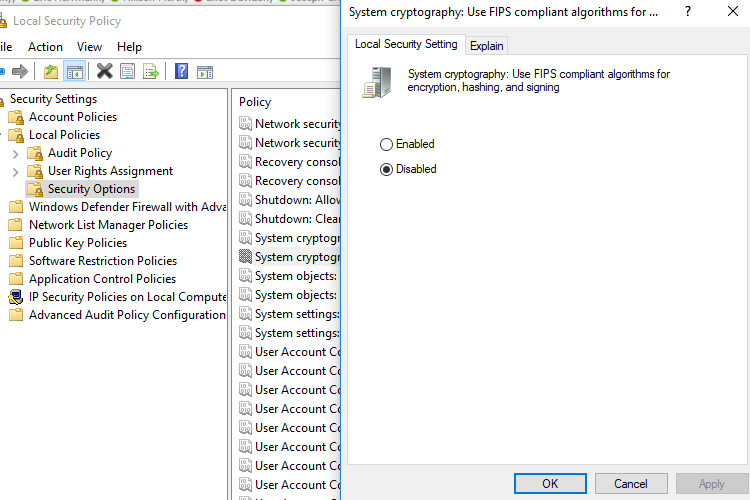
Nuix Discover does not support the use of servers for which the "System cryptography: Use FIPS compliant algorithms for encryption, hashing, and signing" local security policy is enabled. The following figure shows the location of the policy. To disable this policy, select Disabled, and then click OK.
Coding History Troubleshooting
This section covers troubleshooting steps related to Coding History Services and Elasticsearch.
User Audit Log service
This section covers troubleshooting steps related to health checks for services, turning on logging, viewing logs, and checking environment variables.
Health Check
The User Audit Log service features a health check URL that can be used to see if the service is configured correctly and can communicate with Elasticsearch.
User Audit Log Service
To run a health check, on any Nuix Discover web server or the machine(s) running the User Audit Log service, enter the following URLs in a Web browser:
http(s)://<address>:10003: Verifies that the service is running and returns the version number. The response will look something like the following:
{"user-audit-log-service":{"version":"1.4.11"}}
http(s)://<address>:10003/health: Verifies the communication between the Audit Log Service and Elasticsearch and confirms the health of the Elasticsearch cluster. The response will look something like the following:
{"cluster_name":"dev","status":"green","timed_out":false,"number_of_nodes":3,"number_of_data_nodes":3,"active_primary_shards":1431,"active_shards":2862,"relocating_shards":0,"initializing_shards":0,"unassigned_shards":0,"delayed_unassigned_shards":0,"number_of_pending_tasks":0,"number_of_in_flight_fetch":0,"task_max_waiting_in_queue_millis":0,"active_shards_percent_as_number":100}
Turn on logging
By default, logging is turned off for the Coding History service.
Use the following procedure to turn on logging.
Log in to the machines running the service that you wish to enable logging for.
If you are enabling logging for the User Audit Log service, in a PowerShell window, while in Administrator mode, run the following command:
nssm edit ringtail_userauditlog
An example is shown in the following figure.
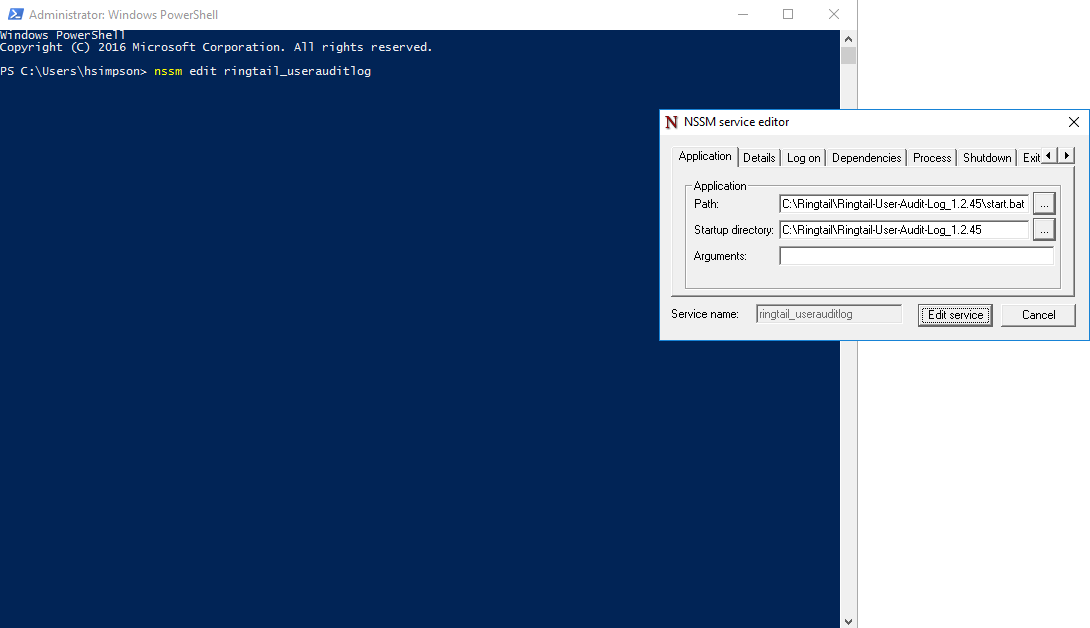
The NSSM service editor dialog box appears.
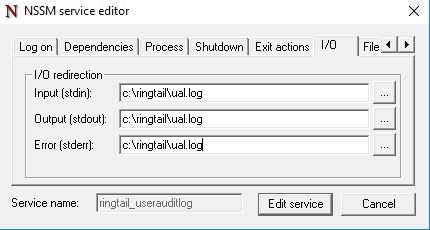
Using the arrow at the top right of the window, navigate to and select the I/O tab. In the Input, Output, and Error boxes, enter the file path and file name you want to use for the log file. The path and file names should be the same for all three boxes.
Click the Edit service button to save your changes.
Restart the service using the following command:
nssm restart ringtail_userauditlog
View the Logs
To view the logs, access them in the location you specified above.
Check environment variables
Check the environment variables on the service's machine to make sure they are set correctly. The details on the variables can be found on the following page:
User Audit Log Windows Installation
Elasticsearch
This section includes troubleshooting steps related to Elasticsearch, including monitoring the Elasticsearch Cluster and running a health check for Elasticsearch.
Health check
To do a Health check, use the following URL:
http://<elasticsearch-hostname>:9200/_cluster/health
You should check for the number of nodes (there should be three) and the cluster status (it should be green).
List indices
To list the indices in the Elasticsearch cluster, use the following URL:
http://<elasticsearch-hostname>:9200/_cat/indices?v
Disk space
To check the disk space, use the following URL:
http://elasticsearch-hostname:9200/_cat/shards?v
If disk space goes below a threshold on the server, Elasticsearch will make all the indices read-only and the User Audit Log service will not be able to write new records to the cluster, and you will get an error like the following.
{
"took": 0, "errors": true, "items": [
{
"index": {
"_index": "ringtail_clean_enron_1557508335_m", "_type": "doc",
"_id" "1763059-10406-76-9892615-1557764459603",
"status": 403,
"error": {
"type": "cluster_block_exception",
"reason": "blocked by: [FORBIDDEN/12/index read-only / allow delete (api)];"
}
}
}
]
}
Use the following procedure to fix the disk space issue.
Delete indices that are not in use.
Check disk space and clear up the disk space on the nodes.
If needed, add additional nodes with more disk space.
After you fix the disk space issue, turn the write permissions back on by running the following command:
PUT _settings
{
"index": {
"blocks": {
"read_only_allow_delete": "false"
}
}
}
PUT \
http://elasticsearch-hostname:9200/_settings \
-H 'Content-
"blocks": { Type: application/json' \
-H 'cache-control: no-cache' \
-d '{
"index": {
"read_only_allow_delete": "false"
}
}
}